Home || Political Parties || Polling Data || Ridings || Marginal Seats || Election News || Women & Elections || Election Laws |
|||||||||||||||||||||||||||||||||||||||||||||||||||||||||||||||||||||||||||||||||||||||||||||||||||||||||||||||||||||||||||||||||||||||||||||||||||||||||||||||||||||||||||||||||||||||||||||||||||||||||||||||||||||||||||||||||||||||||||||||||||||||||||||||||||||||||||||||||||||||||||||||||||||||||||||||||||||||||||||||||||||||||||||||||||||||||||||||||||||||||||||||||||||||||||||||||||||||||||||||||||||||||||||||||||||||||||||||||||||||||||||||||||||||||||||||||||||||||||||||||||||||||||||||||||||||||||||||||||||||||||||||||||||||||||||||||||||||||||||||||||||||||||||||||||||||||||||||||||||||||||||||||||||||||||||||||||||||||||||||||||||||||||||||||||||||||||||||||||||||||||||||||||||||||||||||||||||||||||||||||||||||||||||||||||||||||||||||||||||||||||||||||||||||||||||||||||||||||||||||||||||||||||||||||||||||||||||||||||||||||||||||||||||||||||||||||||||||||||||||||||||||||||||||||||||||||||||||||||||||||||||||||||||||||||||||||||||||||||||||||||||||||||||||||||||||||||||||||||||||
|
Apart from general information on opinion polls, this page provides tables of polling results for you to keep track of changes in voters' preferences as the next campaign unfolds. While the focus of most media attention is often on the national levels of support for the various parties, in the end the regional and local levels of support are much more indicative of how parties may fare on election day.
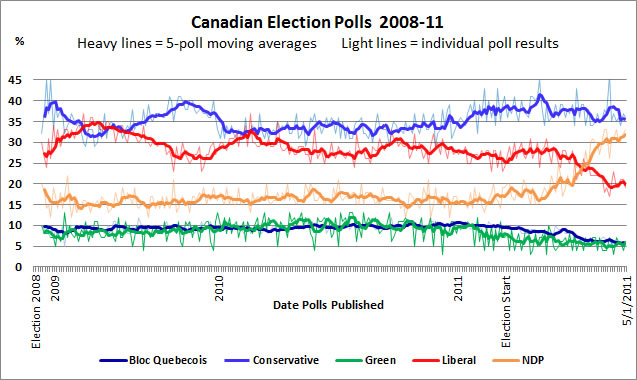
The chart above presents the poll results of many different companies. The dark lines show a moving average of 5 polls at a time, in order to smooth out the sharp and (relatively) meaningless variations that can occur over very short periods of time because of differences in each firm's polling techniques. The survey results are arranged chronologically according to their dates of actual polling, to give a proper sense of the evolution of opinion. Note that some companies, such as Nanos, are doing continuous daily polling during the 2011 election campaign; each day they release a new three-day rolling average of their polling results. In general these daily updates will not be reported here as they will not be sufficiently distinct. Results of these continuous polls will be included in the data here when there is a completely fresh interview base (i.e. every 3 days for a 3-day rolling average poll, such as Nanos publishes). However, I have made an exception with the final round of polls for the campaign, which overlap by a day How accurate are polling companies' reports of voter support? You can view quick charts of polling accuracy from the 2000-2008 elections and see just how right (and wrong) they can be! The televised leaders debate held in English on April 12 may play a role in helping some voters decide whom to vote for. But at times it is difficult to distinguish the entertainment from the informational value of these debates. Over 2,300 Canadians were polled immediately after the English leaders debate by Ipsos, which found that 42% thought that Stephen Harper had won the debate, 25% Layton, and Ignatieff 23%. Of the three leaders, only Layton's debate support is significantly different from the support for each leader's party in the polls. This poll found that 12% of Canadians said they had changed their mind about whom to vote for because of the debate, with the NDP gaining about twice as much as the Liberals who were the next largest beneficiary; it is unclear from this poll whether these individuals previously supported another party or were undecided. Another Ispos poll conducted immediately after the French leaders debate found that 42% of Francophone viewers thought Gilles Duceppe won the debate, while 22% supported Ignatieff, 19% Layton, and 12% favoured Harper. Probing people about their second choices of party to vote for gives some indication of the room for growth each party has in the near future. However, there has been very little movement in second choice support since April 2010 until the final week of the campaign, indicating a very settled set of voter preferences. However in the dying days of the 2001 campaign, the rise of the NDP as a first choice appeared to have drained off some of the NDP second choices that had previously been recorded; in their place, the Liberals and Greens grew to their hightest levels in a year.
Unsurprisingly, an Angus Reid poll conducted in August 2009 found very different perceptions of the different political parties held by the supporters and non-supporters of each party. This poll is worth exploring to assess the strengths and weaknesses each party has in trying to attract more voters. Although polls tend to show some meaningful variations over the course of an election campaign, those changes largely occur because of shifts in opinions held by a minority of Canadians. For example, an Angus Reid poll found that in the 2008 election 54% of Canadians already had made up their minds whom to vote for when the election was first called. But considerable shifts can occur among other voters that make the campaign period very decisive in determining the election outcomes. Interestingly, about 15% finally made up their minds on election day; many of those voters, however, would already have been leaning towards one party. For a better idea of how fluid public support for parties can be, look back to the evolution of public support for the parties during the 2008, 2006, 2004 and 2000 election campaigns. Election polling has evolved in recent elections, and it is now standard for major polling companies to conduct polls continuously throughout the election period. They will report results on a near daily basis, with those polls based on the previous 3 or 4 days worth of polling. You can look up just how successful Canadian pollsters have been in predicting the last 3 elections - compare the support for the parties in the polls and at the polls! Reflections on Polling The Library of Parliament has an interesting background paper on Public Opinion Polling in Canada. Matthew Mendelsohn and Jason Brent of Queen's University provide a useful guide to Understanding Polling Methodology - this is essential reading for an insight into just what significance we can attach to particular survey results. One thing to keep in mind is that most polls are published with the national margin of error reported; but the margin of error will be much higher for any provincial or regional figures that are also reported. The Laurier Institute has an interesting collection of material on opinion polls and electoral support for political parties as well as seat predictions based on the current polls. When reading opinion poll results pay close attention to how large the sample size and "undecided" figures are. A large sample makes for more accurate results, particularly at the regional level. A small undecided figure means that the polling company has probed with follow up questions to finding out who a person is most likely to vote for, and included them in the pool of decided voters. But these leaners, as they're known, are expressing a preference, not a decision. They can also be quite volatile and either change their party preference or even decide not to vote at all. Also be cautious in reading too much into polls that were conducted with only one day of interviewing. Generally speaking, several days of interviews are thought to be preferable in order to ensure more chance of capturing a wider range of society in the poll's sample. Because of differences in polling techniques and handling of leaners, each polling agency may develop their own structural bias that under- or over-reports support for particular parties. Mark Pickup provides a very useful chart showing Canadian election polls with their biases corrected and margins of error mapped. This may be the best indication of the "true" levels of support. The reported levels of support for parties can also vary according to the wording of the questions put in a survey. For example, Nanos fairly consistently reports about a third to a half of the support for the Green Party, compared to Ekos polls. According to Mr Nanos, this discrepancy is because Nanos does not list all the party names in their survey question while Ekos does; the explicit mention of the Green Party reminds disgruntled voters that there is an alternative to the main parties. (Hill Times, June 14, 2010, p.23). The drop in support for the Greens in Nanos polls, leads to higher reported levels of support for the Conservatives and Liberals Undefined depth of support for specific parties A fundamental problem with media reporting on opinion polls is that there is usually little indication in the initial reports of how soft the reported support is for each party, or how each polling company tries to probe for voting intentions. Polls results often loosely proclaim "40% of decided voters... etc" However, that final figure may be based on having to prod the respondents at least twice into expressing a preference: 1) "If an election were held today which party would you vote for?" and, if they say don't know, then they are asked 2) "which party are you leaning towards voting for?" The second group are only leaning and should not be viewed as actual support, and yet most polling companies roll the leaners in with the truly decided. Moreover, even those who name a party on the first question may still be actively considering another party (or whether to vote at all). It would take other specific questions to establish that the voter has settled their choices and is not likely to switch parties. We in the public often miss the fluid nature of public opinion captured when polls are reported. It is not often clear how settled are the voting intentions reported in a poll. Thus it is useful when a polling agency releases results of questions that probe the nature of people's voting decisions. A Segma poll released a week before the October 2008 election showed that a third of voters could still change their minds about which party to support. Several polls during the 2006 election showed large numbers of voters were prepared to change their vote. The potential for voters to switch in the last days of the campaign was realized in the 2004 election, when the Liberals gained and the Conservatives dropped several points in the last 2-3 days before voting day. Because of this potential for voters to switch their choice of party or candidate, it is important to follow the polls to track the ebb and flow of public opinion during an election campaign.
* Numbers may not add up to 100
due to rounding
and support for "other" parties
Other sponsors may be identified in the Canadian election polls linked to in the table of results, above.
|
|||||||||||||||||||||||||||||||||||||||||||||||||||||||||||||||||||||||||||||||||||||||||||||||||||||||||||||||||||||||||||||||||||||||||||||||||||||||||||||||||||||||||||||||||||||||||||||||||||||||||||||||||||||||||||||||||||||||||||||||||||||||||||||||||||||||||||||||||||||||||||||||||||||||||||||||||||||||||||||||||||||||||||||||||||||||||||||||||||||||||||||||||||||||||||||||||||||||||||||||||||||||||||||||||||||||||||||||||||||||||||||||||||||||||||||||||||||||||||||||||||||||||||||||||||||||||||||||||||||||||||||||||||||||||||||||||||||||||||||||||||||||||||||||||||||||||||||||||||||||||||||||||||||||||||||||||||||||||||||||||||||||||||||||||||||||||||||||||||||||||||||||||||||||||||||||||||||||||||||||||||||||||||||||||||||||||||||||||||||||||||||||||||||||||||||||||||||||||||||||||||||||||||||||||||||||||||||||||||||||||||||||||||||||||||||||||||||||||||||||||||||||||||||||||||||||||||||||||||||||||||||||||||||||||||||||||||||||||||||||||||||||||||||||||||||||||||||||||||||||