- Graduate
- Undergraduate
- Research
- News & events
- About us
- Student Commons
- Contact us
- Somers Research Group
- Faculty and Staff Resources
- Next Steps
- Incoming Students
- Spring 2020 Convocation
- The Roundtable
- Conversion Therapy Survey
- Fall 2020 Convocation
- RESET Team
- Spring 2021 Convocation
- Planetary Health Research Group
FHS researchers develop first national open-source dataset for cycling infrastructure
by Sharon Mah
Investigators from the Cities, Health and Active Transportation Research (CHATR) Lab at Simon Fraser University’s (SFU) Faculty of Health Sciences (FHS) launched a national dataset that identifies bicycle infrastructure in Canadian neighbourhoods using a consistent and standardized classification system. The data is visualized and presented in an interactive, open source map, allowing – for the first time – comparison of data across multiple jurisdictions, and deeper investigations of active transportation issues on a national scale.
“This national dataset provides consistent, common names, data types and quality information that was not available before,” says CHATR Lab lead and Faculty of Health Sciences (FHS) professor Meghan Winters. She explains that some of the challenges that stymied national studies of bicycle infrastructure included different cities classifying their bicycle infrastructure in different ways using different labels, or communities not having access to spatial data or not having capacity to generate maps of bicycle infrastructure. She observed that not only will this dataset address these data equity issues between Canadian cities, it will also make it easier for regional, provincial, and federal governments – along with researchers, practitioners, and advocacy groups – to explore their own communities as well as learn from peer communities. The national dataset will also enable linkages to other national datasets, including census data and the Canadian Community Health Survey tool.
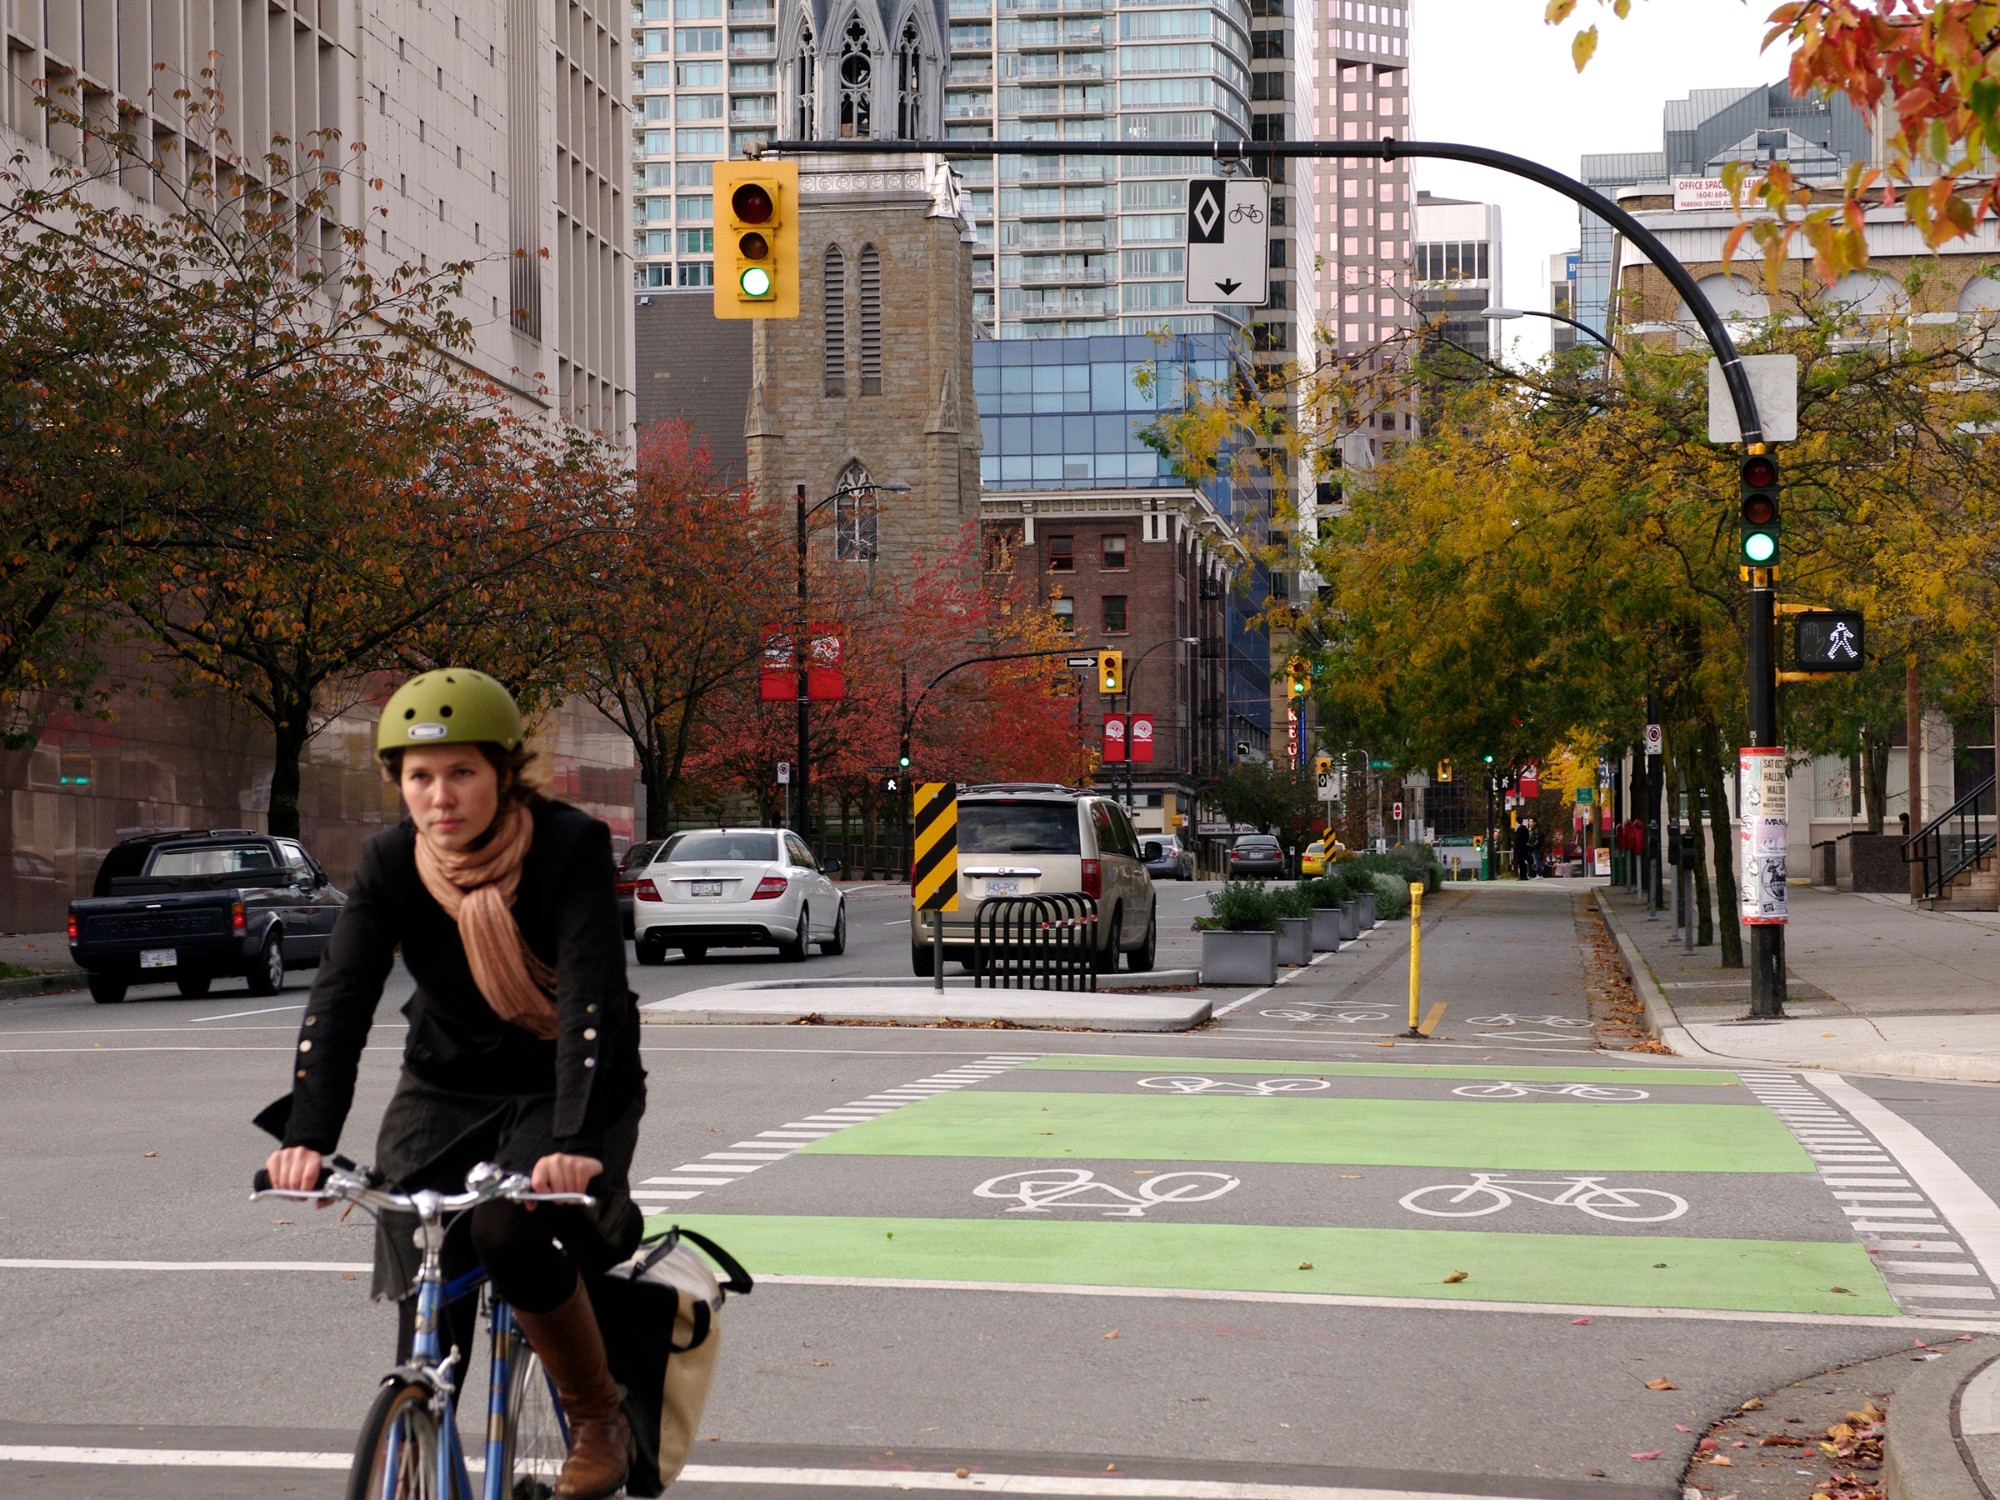
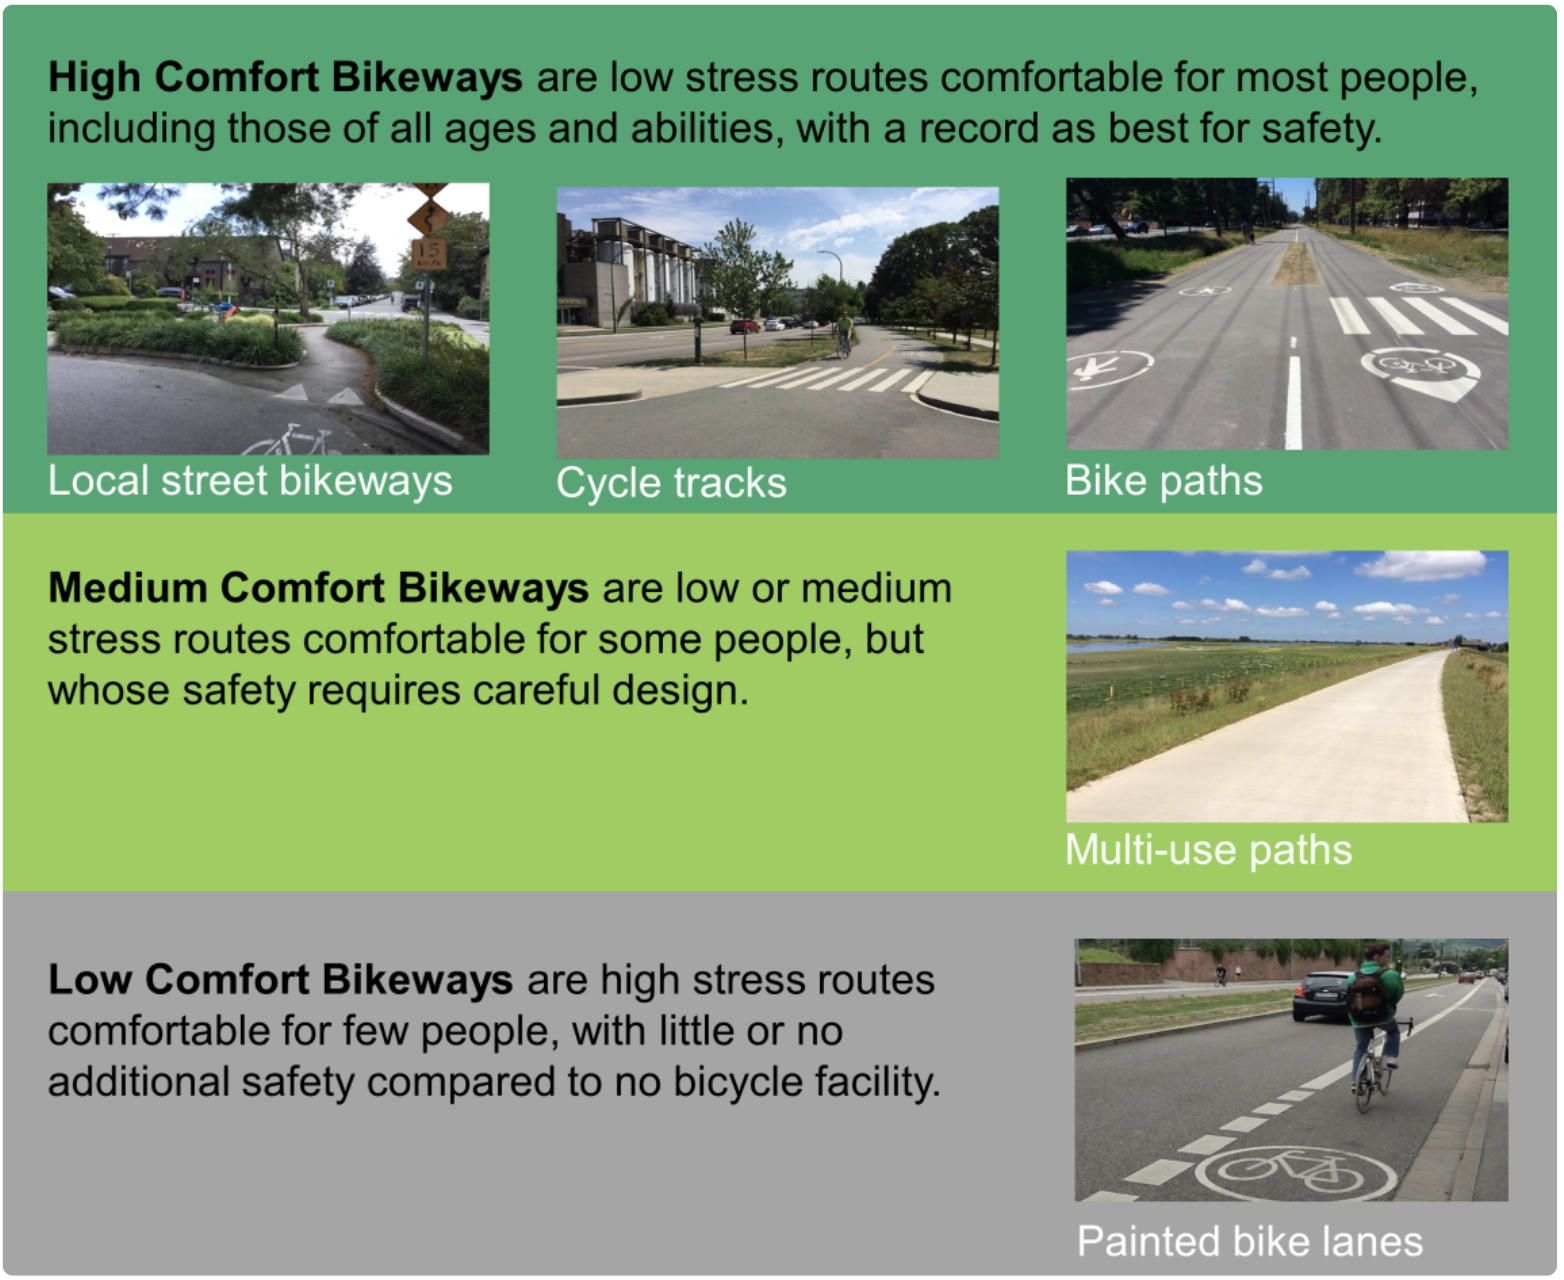
The new national dataset is derived from OpenStreetMap.org, a crowdsourced mapping tool, colloquially known as the “Wikipedia of mapping.” CHATR Lab researchers extracted OpenStreetMap data, and classified it based on tags (crowdsourced details) as well as nearby features (is a path next to a road?), landcover (is a path in a natural or urban area?), and network attributes (is there traffic calming or diversion along a route?).They overlaid data about existing bicycle infrastructure onto this map using the Canadian Bikeway Comfort and Safety Classification system (Can-BICS), assigning structures into high-, medium-, and low-comfort categories. The Can-BICS system reflects the comfort of people in cycling on certain types of routes, and is based on transportation engineering design guides and health and safety research. Bicycling infrastructure that does not meet the minimum standards for inclusion in the Can-BICS system (e.g., there may only be signage used to improve cyclist comfort or safety on major roads) are classified as “non-conforming” in the dataset. (See Figure 1 to learn what infrastructure are included in the Can-BICS system.)
“Canada has a network of more than 72,000 kilometers of things that were coded in some way as cycling infrastructure,” say Winters. “This analysis indicated that 23,000 [km of this network] met the Can-BICS criteria of high, medium, or low cycling infrastructure.”
CHATR Lab research associate Colin Ferster developed the open source code that powers the national bicycle infrastructure map and recently co-authored a paper with Winters describing how the tool was developed, and the data contained within, verified. “[When]we pull the data out and apply our tags to it, we’re highlighting the attributes within that dataset that are important for cycling safety and preference.”
The dataset is not live – it represents a snapshot in time of the bicycle infrastructure in Canada. Through the development process, Ferster and team have been reaching out to municipal staff, advocacy groups, practitioners, and research partners across Canada to provide feedback on the data, and promoting “map-athons” on the lab’s social media accounts. The current national dataset was collected in 2022 and represents the lab’s baseline or benchmark for future comparisons.
Ferster is planning on conducting yearly updates to visualize bicycling infrastructure changes over time. Winters observes that cities are building bicycling infrastructure very rapidly right now. “We’re interested in seeing whether we can detect changes made year on year. The vision for [this] project is that we'll be able to look and [see] which neighbourhoods are seeing investments or change as they show up [on the map].” The researchers hope to be able to identify which communities are seeing the most benefit from regional, provincial, and federal government investments in active transportation.
Winters notes that cities are facing many challenges to meet their climate sustainability goals and that active transportation could make a difference. The question is how do we make active transportation choices that are healthy, safe, sustainable, and equitable without knowing who has access to bicycle infrastructure and who doesn’t? “We need a high quality of bicycling infrastructure so that people feel safe choosing to bike, and we need to make sure that it’s available for all communities [across Canada]. Most people don’t feel comfortable cycling adjacent to or alongside motor vehicles. We need to make sure that the infrastructure we are building meets the needs of people, is close to where they live, and connects them to the places they need to go.”
Read the paper by Ferster et. al. (2023) outlining the development of the national Canadian dataset on OpenStreetMap.
Visit the CHATR Lab web site: https://chatrlab.ca
T I L